Use the sales report
Pick any dates to see sales, tips, payments, food cost and labor, compared with the period before.
Also known as: weekly sales · monthly sales · year to date · ytd · quarterly · trend · sales comparison · period report · revenue report · best day
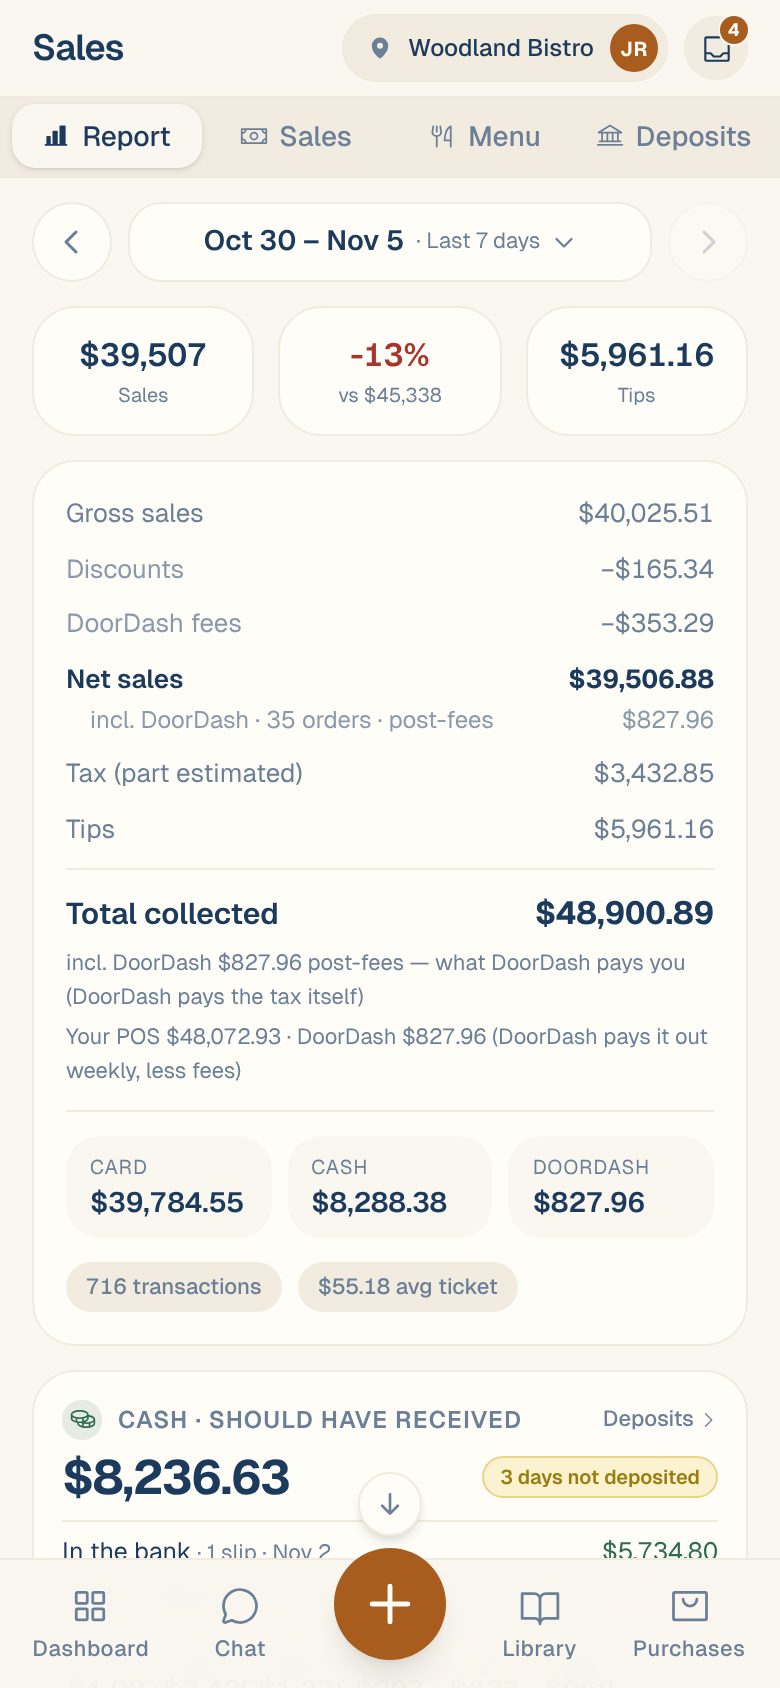
The Report tab sums up your sales for any dates you pick, from one day to a whole year, and compares them with the period before.
Pick your dates
- Open Sales from your Dashboard (see Find your sales). It opens on Report, showing Today.
- Tap the date bar at the top.
- Tap a shortcut, like Yesterday, This week, Last 7 days, This month, Last month, This year or Last year. Quarters and your Payroll period, if you’ve set one, are in the same row.
- Or pick your own dates under Choose a Date Range: tap the first day, then the last, then Apply. Tap the month name to jump to another month or year.
The ‹ and › arrows either side of the bar step back or forward by the same length.
Weeks start on Monday. Choosing Today also fetches the latest sales from your POS or terminal.
What it compares against
Every report compares with the period before, chosen for you:
| You picked | Compared with |
|---|---|
| One day | Same day last week |
| A whole month | Previous month |
| Anything else | Previous period of the same length, right before it |
The second tile at the top shows the change as a % and the other period’s total.
What’s on the report
| Section | What it shows |
|---|---|
| Top tiles | Sales, the change vs the other period, and Tips. |
| Summary | From gross sales down to Total collected, with the Card and Cash split, transactions and average ticket. See Net sales vs total collected. |
| Share of sales | Each source’s part of your sales: your POS’s payment types, ordering apps and logged cash. |
| Payments | How guests paid, by payment type, with tips, gratuity and refunds. |
| Chart | One day: sales by hour. A longer range: a bar per day, per week past about six weeks, or per month past about four months. The dashed line is the other period. Tap a bar for exact figures. |
| Food cost (COG%) | Your purchases as a % of sales. Longer ranges break it down by week or month. |
| Labor (labor %) | Labor cost as a % of sales. Tap it to open the Labor report. |
| Two-source days | When you have a POS and a card terminal, how many days they matched. Tap to list the days that didn’t. |
| By server | Card sales and tips per server, from your card terminal. |
| Channel mix, By daypart, Speed of service, Guests | Dine-in vs takeout vs delivery, sales by time of day, how fast checks close, and top guests. These show when your POS sends that detail. |
Sections only appear when there’s something to show, so a terminal-only location sees fewer of them than one with a full POS.
Common questions
Can I share a report with someone?
Yes. The dates you picked are part of the page’s address, so when you send the link to someone on your team who has that same location open, they see the same dates.
Why is food cost % so high this week?
It’s purchases divided by sales for the same dates. A big delivery early in a short range pushes it up. Look at a full month for a steadier number, and see Food cost % and its colours.
Some days are marked as having a sources-disagree flag.
On those days your POS and card terminal didn’t agree. Open the day on the Sales tab and look at its Card check. See Check your POS against your card terminal.