Track your labor % over time
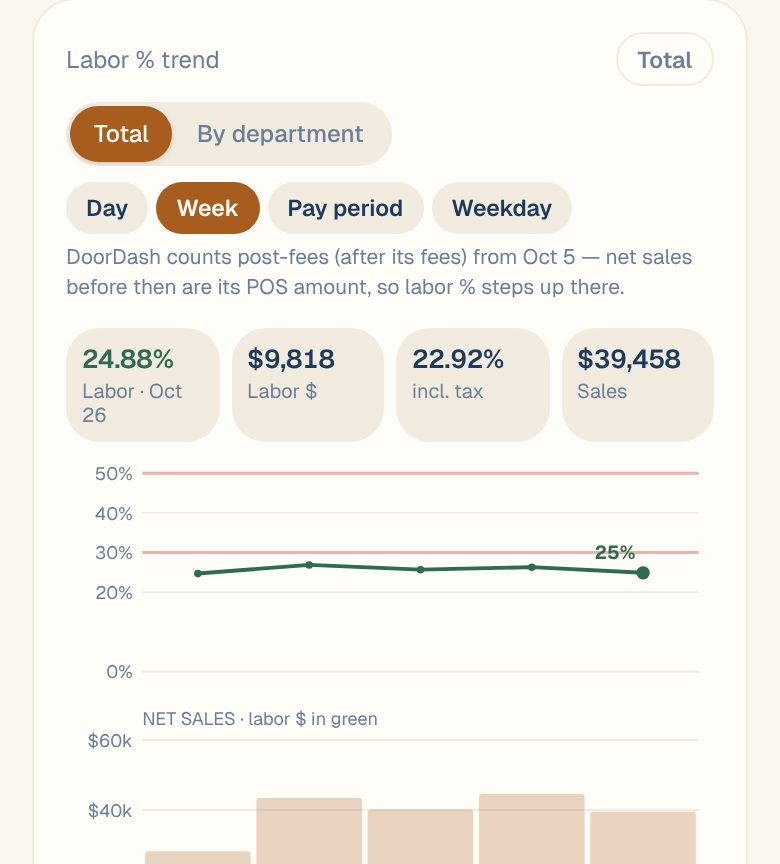
The Labor % trend chart shows labor % by day, week, pay period, month or weekday, with sales underneath.
Also known as: labour chart · trend line · by week · by month · history · graph · labor over time · weekly labour · compare weeks · average day
The Labor % trend chart on the Labor Report shows how your labor % moves over the dates you pick. Use it to spot the days or weeks that run heavy, and to see if a change in scheduling made a difference.
Open the trend
- From the Dashboard, tap the Labor title. You’re on the Report tab.
- Pick at least two days at the top, like Last month. The trend doesn’t show for a single day.
- Scroll to Labor % trend, under the labor cost.
Read the chart
- The line at the top is labor %. Faint lines mark 30% and 50%, the points where labor % turns amber and red.
- The bars underneath are net sales, with the labor dollars inside each bar in green.
- The tiles above show the latest point: labor %, Labor $, labor % incl. tax, and Sales. Tap or drag across the chart to see any other point.
Where there were no sales, the line has a gap and a note says so. Labor % of nothing isn’t 0%.
Group by day, week or month
Tap a chip to change what each point covers. The chips you see depend on how many days you picked:
| Chip | Shows | Offered when |
|---|---|---|
| Day | One point per day | Always |
| Week | One point per week | 14 days or more |
| Pay period | One point per pay period | 28 days or more, once your payroll period is set |
| Month | One point per month | 56 days or more |
| Weekday | Your average Monday, Tuesday and so on | 14 days or more |
For Week, Pay period and Month, the button at the top right switches between Total and Avg / day. Avg / day makes a short week or month fair to compare with a full one.
With Weekday, a note under the tiles says how many of that day were averaged, like 4 Mondays averaged. If a slow day is in the mix, it’s named so you know the average includes it.
See each department
If you’ve set up departments, tap By department at the top of the card. You get one line per department plus the total, so you can see if the kitchen or front of house is driving a change. Tap Total to go back. Maitaki remembers which one you picked.
Common questions
Why did my labor % jump on one day?
Tap that point to see its labor and sales. A low-sales day, like a holiday or bad weather, pushes labor % up even when hours were normal. A note under the tiles names any slow day in the point you’ve tapped.
The chart says an ordering app "counts post-fees". What does that mean?
From that date, sales from that ordering app count after its fees. Net sales drop a little, so labor % steps up there. Nothing is wrong with your labor.
Why can't I see Pay period?
Set your payroll period first, and pick at least 28 days. See Set your payroll period.