Read your Purchases report
Spend, coverage, the spend trend and COGS % for any dates.
Also known as: spend report · purchases total · cogs · cost of goods · food cost · by category · spending chart · weekly spend · monthly spend · purchasing report
The Purchases report answers one question: is what you spend on supplies going up or down? It adds up your invoices for any dates you choose, shows how much of that is checked, and breaks it down by vendor, category and price.
Open it
Tap Purchases at the bottom of the screen. It opens on the Reports tab.
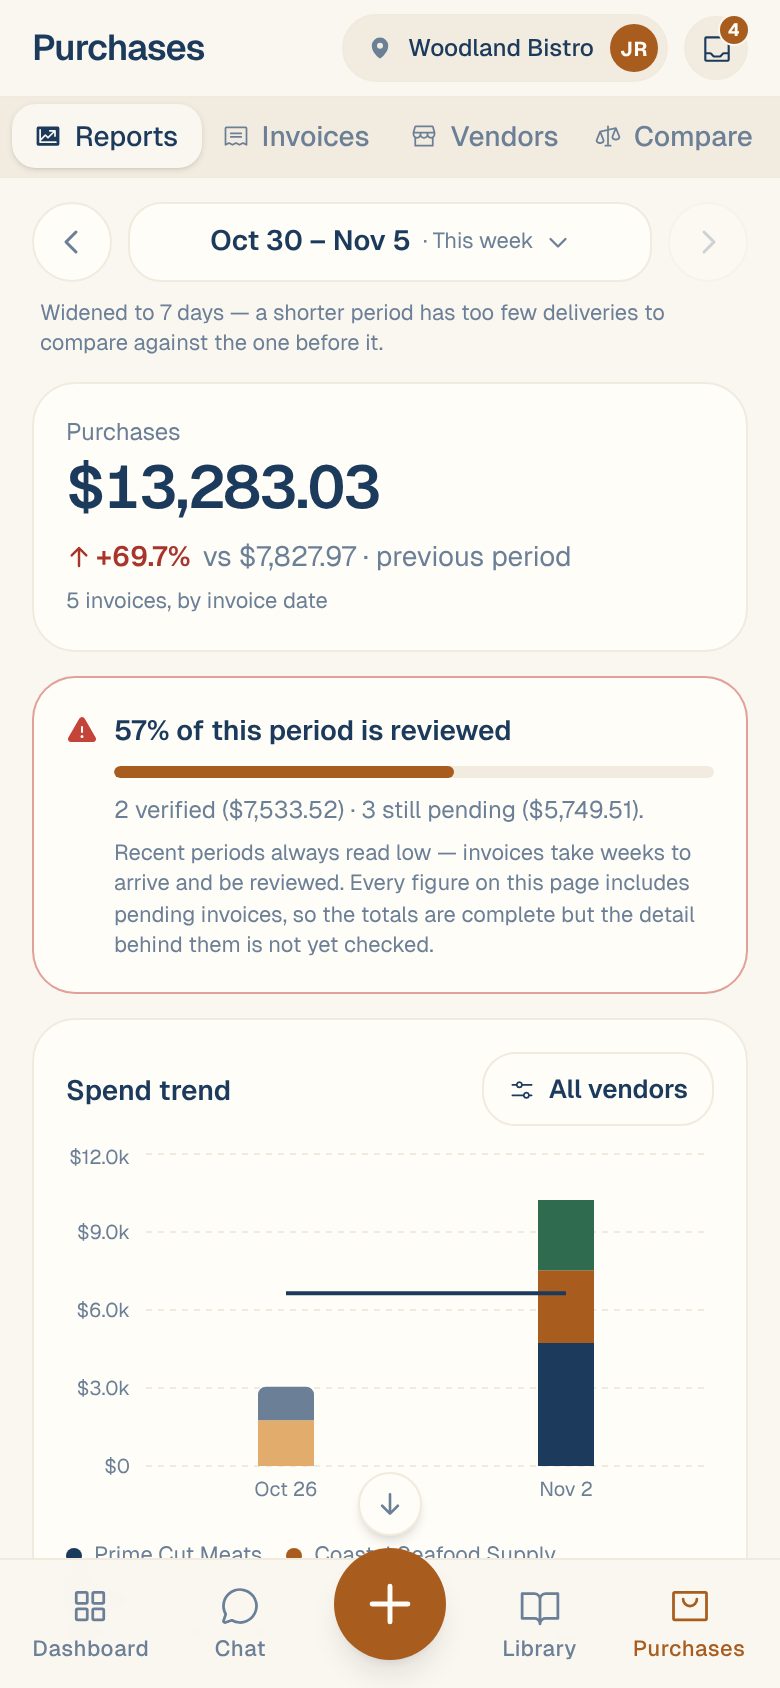
At the top, pick your dates: tap the date range to choose a period like This week, Last month or This year, or use the arrows to step back and forward. The shortest period is 7 days. A shorter one is widened, and you’ll see Widened to 7 days.
For longer periods, Bars show each lets you switch the charts between Week and Month.
What each card shows
Purchases
The total of your invoices in the period, by the date printed on each invoice. Under it, the change from the period before, for example +69.7% vs $7,827.97 · previous period, and how many invoices it covers.
Order confirmations, statements and possible copies never count.
How much is reviewed
57% of this period is reviewed (for example) shows how much of the total comes from verified invoices, and how much is still pending. The total already includes pending invoices; this tells you how much of the detail has been checked. Recent weeks always read low, because invoices take time to arrive and be reviewed.
Spend trend
Bars for each week or month, stacked by vendor: your top five, with the rest as Other vendors. The line is a rolling average, which smooths out a big delivery landing in one week and none the next.
Above the chart, a verdict compares your recent weeks with the same number of weeks before them, such as Up 12% or About the same, with the weekly amounts.
Tap All vendors to pick which vendors the bars, line and verdict count, then tap Show. Under the chart, By vendor lists each vendor’s spend and share.
COGS %
Your purchases divided by your net sales for the same period. It needs a connected POS. Without sales, it says No sales data at this location for this period. Missing data? Check this location’s connections, at the bottom of the report, takes you to your location’s settings. See Connect your Toast POS or Connect your Clover POS.
By category
Spend by ingredient category, like Meat or Produce. Only invoice lines linked to an ingredient have a category, so tax, fees and unlinked lines aren’t in it. When that leaves some out, you’ll see Covers $X of $Y.
Price moves
The ingredients whose price changed most over the period, like $4.54 → $5.04 /lb · Prime Cut Meats. Switch between Biggest (the largest overall change) and Most volatile (the most up and down between deliveries). Tap a row to open the ingredient.
Each ingredient is measured at its main vendor, so switching to a cheaper vendor doesn’t show up as a price drop.
Common questions
Why is a delivery in the wrong week?
Purchases count on the invoice date, which isn’t always the day it was delivered. If the date was read wrong, fix it on the invoice. See Change an invoice’s vendor, number, date or total.
The total looks too low.
Check that every invoice is in. Each vendor’s page shows delivery days with no invoice. See Spot invoices you haven’t received.
How do I see one vendor's spend on its own?
Open the Vendors tab and tap the vendor. See Your vendor page.